|
|
|
|
|
|


 |
|||
| Product Main Page | |||
| Key Features | |||
| System Requirements | |||
| Documentation | |||
| Downloads | |||
| Support | |||
EASy 3.50
Key Features
- Specifically designed for marine applications
- Instant web deployment
- Access to spatial and temporal dimensions
- Relational database-driven environment
- Advance modeling functionality and data analysis tools
- Handles a wide variety of oceanographic data formats
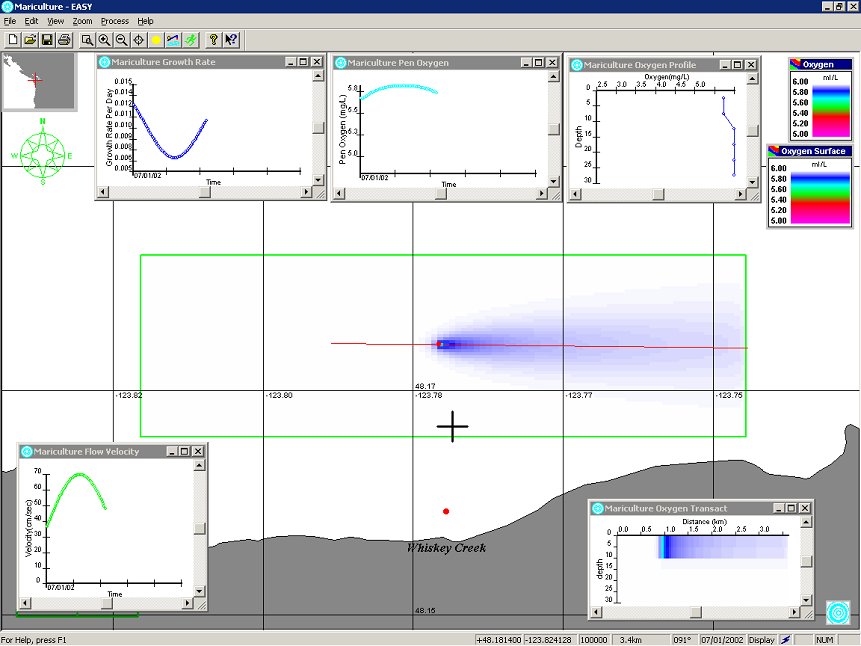
Access to spatial and temporal dimensions
EASy is the dynamic (time-based), 4-dimensional home
for data, allow 2-dimensional (map-based) visualization with interactive
drilling and slicing of dynamic 3 dimensional fields. EASy handles both
historical and real-time data streams. It graphically renders
dynamically in time, within their proper geo-spatial context, both field
and remotely sensed data and model outputs as diverse types of plots,
including vector, contour, and false color image plots. Vertical structure
of data, critical in oceanographic applications, is depicted as vertical
contours for user-defined transects or depth profiles at selected point
locations. Time series of measurements, and dependencies between data
at individual stations can also be visualized interactively as XY-plots.
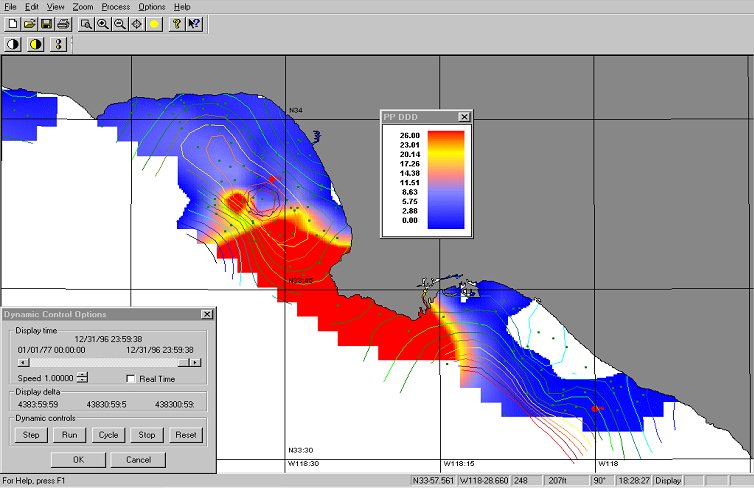
EASy can display data in many ways: XY-graphs, bubble charts, contours, false color, and many others
Here EASy plots the DDT concentration within fauna as a false color plot (top), and mariculture data model with time-series XY-plots (below).